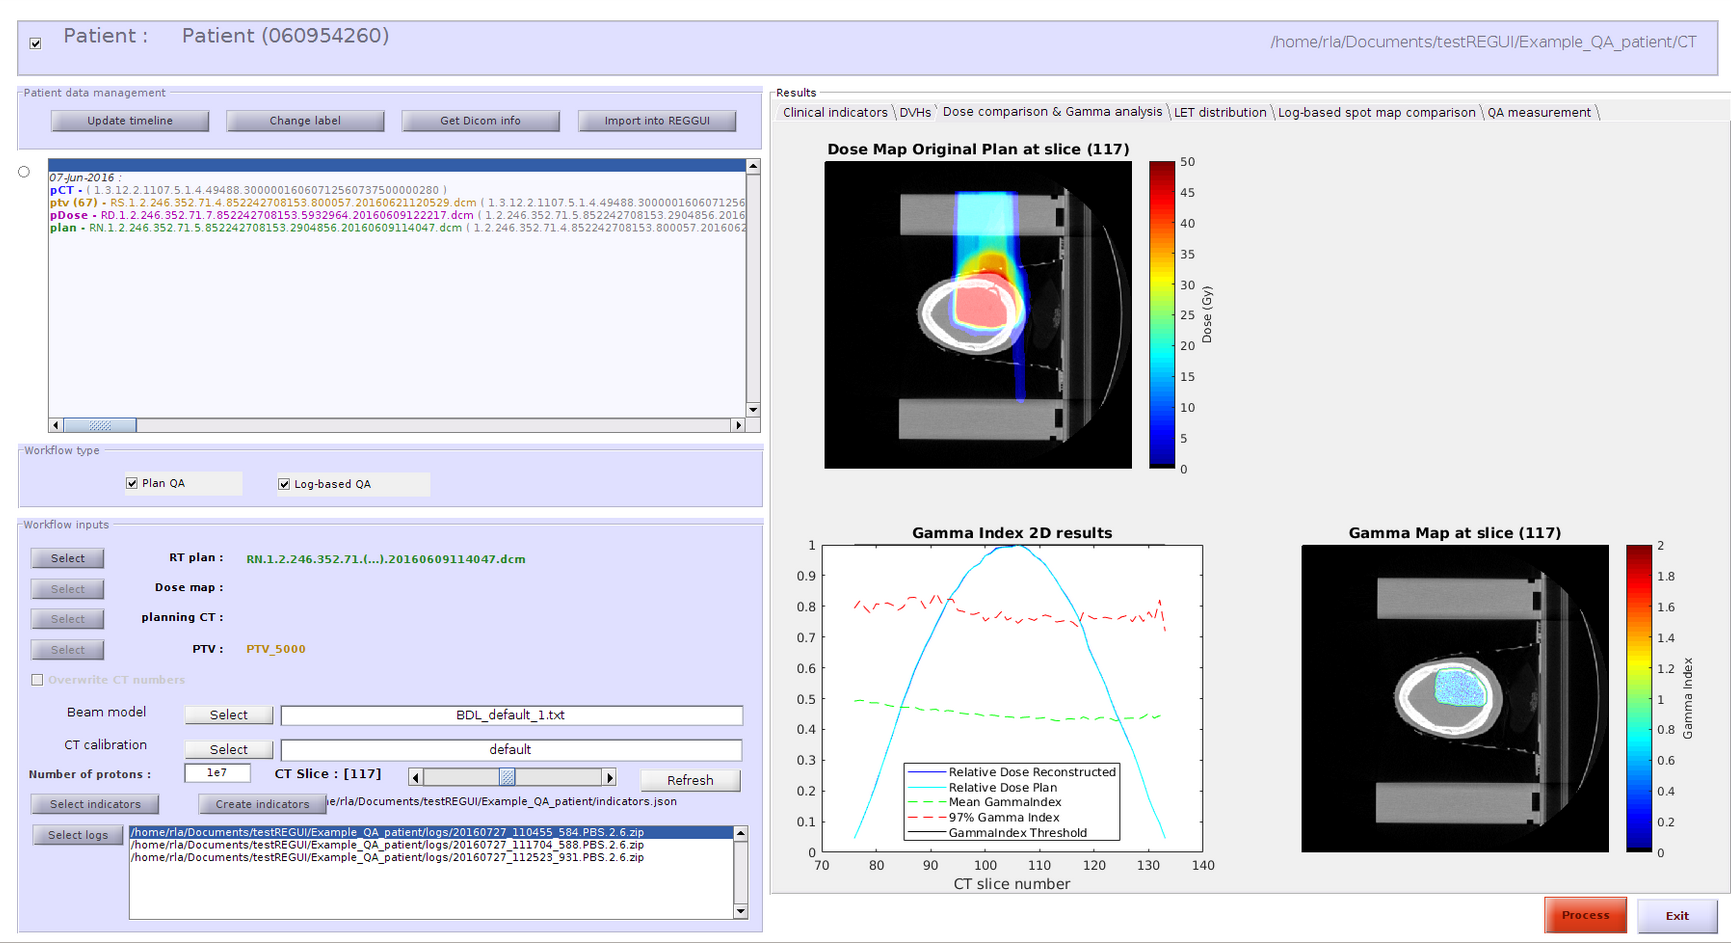
You can now recompute the dose map delivered by a RT-ion treatment plan for Pencil Beam Scanning (PBS), using the MCsquare Monte Carlo dose engine and compare this dose map to the treatment planning system. This provides a validation by a secondary Monte Carlo dose engine of the TPS computations, which can be especially interesting for highly inhomogeneous materials. The comparison between the dose maps is evaluated by a set of statistical tests, and the results can be reviewed through the GUI.
As well, it allows you to reconstruct the delivered dose map by directly using the recorded information from the Pencil Beam Scanning (PBS) irradiation logs of the proton therapy machines. The records of the PBS spot position and delivered MU are extracted from the logs and the dose delivered by each PBS spot is computed using the MCsquare dose engine on the specified CT scan. The expected dose map (obtained previously from the secondary dose computation) and the delivered dose maps can then be compared. Different analysis are made: comparison of clinical indicators related to different anatomical structures, comparison of dose volume histogram (DVH) curves, gamma index, statistical analysis on the spot position error and MU error. Access it here.

